
OVERVIEW
SeqExpress can be freely disseminated to anyone with no restrictions or fees associated with it's usage. Email based support for the software is provided free of charge by the author. SeqExpress runs as a standalone application, an optional server is available to support project working.
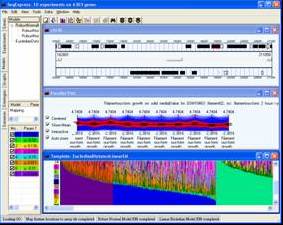
The SeqExpress gene expression application suite provides: a number of clustering and analysis techniques; integrated gene expression and analysis result visualisations, integration with the Gene Expression Omnibus; and an optional data sharing architecture. SeqExpress is free, user-friendly and runs under Windows.
VISUALISATIONS
A number of visual tools are provided for: the direct examination of gene expression data; representation of gene expression variance; hierarchical and model-based category visualisers; the results of the clustering algorithms; genome feature visualisations; and the visual exploration of ontologies .
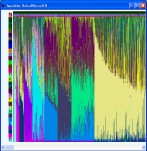
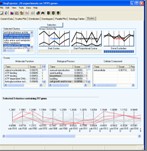
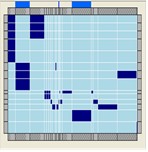
Expression Data Visualisations
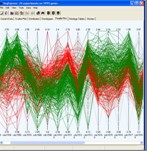
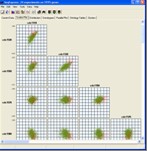
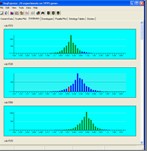
Tools are provided for visualising gene expression data, these include parallel coordinate plots, n-dimensional scatter plots and histograms. Table based views are also provide for editing lists of genes, displaying related gene annotations and experimental results.
 |
 |
 |
Gene Variance Visualisations
Tools are provided for visualisation the variance that occurs within gene expression profiles. This variance can either be defined as being the variance across replicate experiments or can be based on a model. In the current beta the implementation of these visualisations is incomplete.
 |
 |
Analysis Visualisations
Visualisations are provided to explore the results of both hierarchical analysis and probability model analysis.
 |
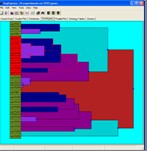 |
Cluster Visualisations
Visual tools are provided for both the examination of the results of a cluster analysis (intra-cluster analysis) and for the comparison of different sets of clusters (inter-cluster analysis).
 |
 |
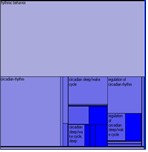
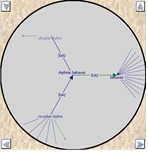
Ontology Visualisations
A number of different visualisations are provided for the exploration of ontologies, these are available both within SeqExpress or as a separate tool. Matrix, treemap, table and graph based views are supported.
 |
 |
 |
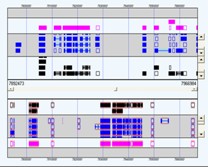
Genome Feature Visualisations
Chromosomes (or contigs) and associated features can be explored in SeqExpress. Additionally a genome browsing tool is also available, which uses a variety of different layout/packing options to show the features on a chromosome/contig.
 |
ANALYSIS TOOLS
SeqExpress includes a number of novel clustering algorithms and analysis tools which have been specialized to deal with different types of gene expression data. More information is available in the help pages. A number of partitioning, hierarchical and probabilistic clustering algorithms are available within SeqExpress, In brief, SeqExpress has inbuilt support for:
Cluster discovery and validation. Clusters can be found using a variety of distance measures, once found the clusters can be validated by finding their C-Index (using either the same or different distance measure). The clusters will divide the genes into distinct (non-overlapping) sub sets.
Cluster Refinement . Once clusters have been found they can be refined by either looking for enrichment of a predefined category (e.g. do any of the clusters have a particularly high or low concentration of any gene ontology term) or by looking for a mixture of models (e.g. looking for a mixture of normal sub-distributions).
Heuristic based approaches are available for the analysis of gene expression experiments. One analysis is available explicity for SAGE experiments, another is provided for discovering correlations between gene expression profiles and gene proximity on a chromosome.
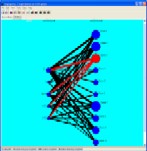
Discovering graphs. Graph of genes can be generated that represent either the results of an expression experiment, the proximity of genes to each other on a chromosome or the relationship between known gene functions (as described in an ontology). One set of criteria can be used to define the graph, another can be used to encode lengths to the edges between the connected nodes. These graph can then be partitioned into clusters.
Discovering mixtures of models. Models and associated gene probabilities can be found using SeqExpress. These models can represent information in an ontology, the location of features on a chromosome or the expression of genes. Once found the models can be used to generate clusters, can be combined together to answer complex questions or can be used as a template for further analysis.
Building gene hierarchies. These will establish a hierarchical structure which represents the differences between the different gene expression profiles. A variety of tools are provided and each differs in terms of speed and descriptive power (SDD is the quickest method, however hierarchical analysis using a complex distance function can be the most descriptive). Additionally some are more suitable for different types and distributions of data (SDD is suitable for SAGE).
Data filtering, transforming and constraining are supported. Genes can be filtered out of the experiment either by direct manipulation or by specifying a set of numeric values. Rank, log, proportional and normalization data transformation procedures can also be applied to the data sets.
Searching. A number of options are available to search the expression profiles (based on keyword, gene ontology term, numeric value, or though an interactive 'what if' tool). Predefined categories of genes (e.g. gene regulation modules) can be also be loaded into the system to aid analysis.
Projection techniques are provided to study both co-occurance and co-variance properties of the data sets. Additionally a projection is available to aid in the validation of clusters.
DATA INTEGRATION
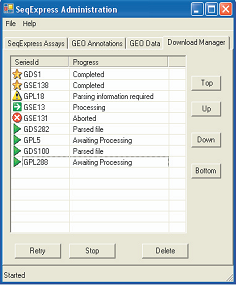 |
The purpose of the GEO integration tool is to provide a convenient means for the local analysis of remote publicly available experiments. As the tool is designed for convenience, as much of the data retrieving, file parsing and database loading process is automated. Where possible a ‘one-click’ access approach is adopted, so that associated data files (e.g. annotation or platform files) are retrieved automatically and database configuration rules are used for parsing. In situations where choices have to be made (e.g. selection of values in experimental data files, choices on which annotations are required), simple wizards are provided. Information about relationships between the different annotation types is used to provide automatic mappings of identifiers. For example, if a platform file has Unigene identifiers, then the GO terms for each entry will be resolved at run time (by matching the platform row id to the Unigene cluster, then to the corresponding set of LocusLink ids, and finally to the Gene Ontology terms). |
The system uses inbuilt rules for the parsing of commonly used annotations, and mappings between identifiers can be edited by the user. Due to the high throughput the local database is continually maintained (through memory parameters, regular defragmentation, statistics calculations and integrity checks).
SHARING INFORMATIONn
Small groups (up to 5 clients) can share a common SeqExpress server, which acts as a central repository for both annotations and experiment results. The client is available as a separate download, and must run on the same LAN as the server machine. Additionally SeqExpress integrates with R, and as with the SeqExpress server, this can be local or remote.
Last updated: 05/July/2008