Any selection is propagated to all other selections. This means that if you select an item in a parallel plot then this selection will be echoed in all other open visualisations, additionally, any items in the gene tab that contain one of these genes will be flagged in the 'contains' column. Examples of using such selections are given below:
All the views are linked in SeqExpress, so that if a gene is selected in one visualisation then the same gene will also be selected in all open visualisations (wheither they be views on genes, their expression profiles, genome location or an ontology). Any items that have been selected can also be saved a new selections in the gene tab. From within the gene tab it is possible to rename, delete, merge or edit these selections. A number of visualisation are provided, these each show different aspects of the data and perform different functions. Seven types of visualisation are provided:
Gene Views
Gene Table gives information about genes, their individual experiment expression value, associated annotations and any descriptions
Gene List Editor allows for the editing of sets of genes
Gene Expression Visualisations
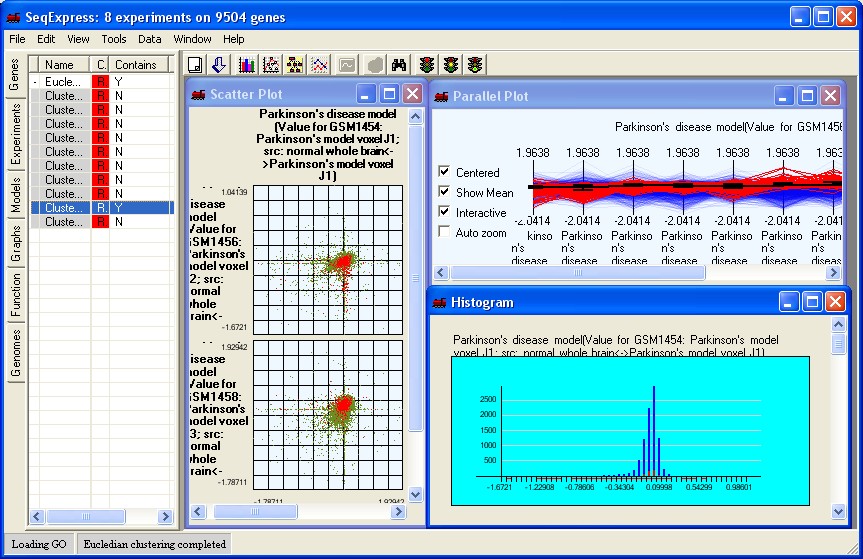
Scatter plots are provided for examining covariance (bivariance) between the experimental data sets.
Histograms are provided for looking at the distribution of the data
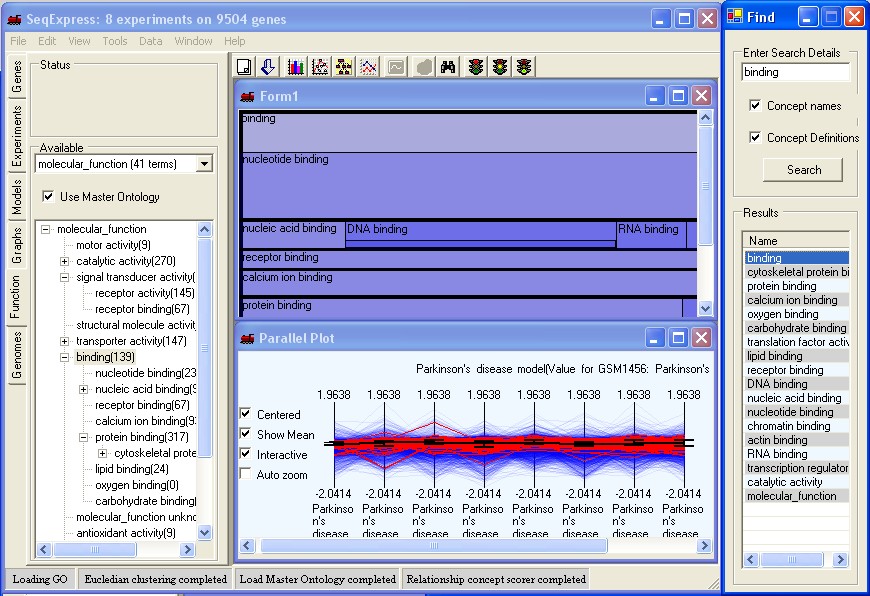
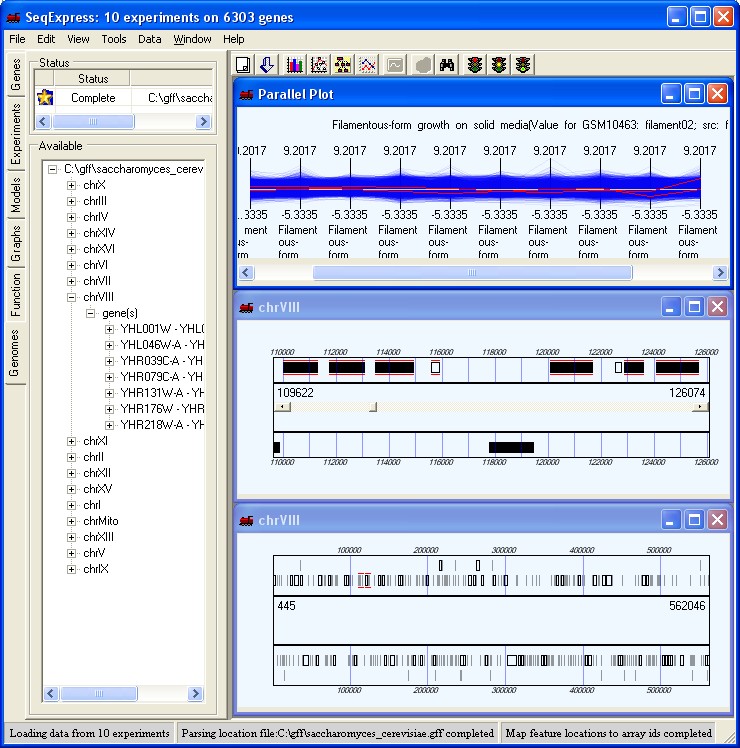
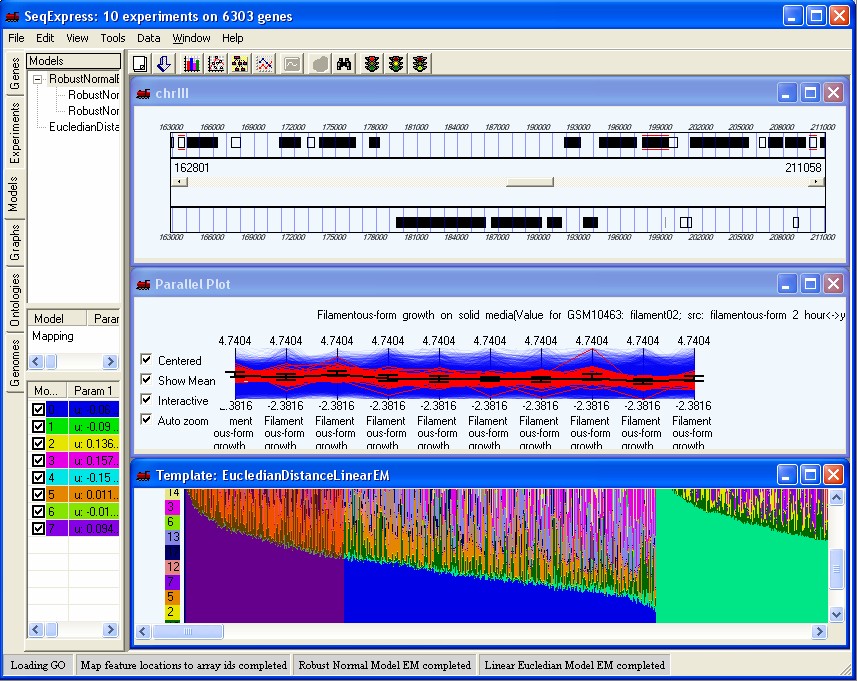
Parallel projections to show all the the expression profiles.
Gene Variance Visualisations
Gene Spectrums which show the variance that occurs in a single expression experiment
Gene Clouds which can be used to comapre the variance that occurs within two experiments
Cluster Analysis Visualisations
Cluster comparison tool is provided to compare the results of two different cluster analyses or the results of a cluster analysis against a biological relevant categorization (e.g. cell cycle, disease state, regulatory networks information)
Cluster viewers are provided to examine differences/similarities between the clusters resulting from an individual analysis/algorithm.
Chromosome Location Visualisations
Genome viewer for the visualisation of the position of genetic elements on a chromosome
Gene Ontology Visualisations
TreeMap visualisations for examination of scores associated with concepts (e.g. number of assigned instances)
Ontology Graph visualisations for the analysis of interrelationships within the ontology;
Table Visualisations for the viewing and editing of the specific concept details
Model and Hierarchy Visualisations
Probability Model visualisations are provided for exploring the results of a mixture model analysis by showing the probabilities of each gene belonging to each model
Dendograms are provided for viewing the hierarchical relationships within the data which have been established using one of the hierarchical cluster techniques.