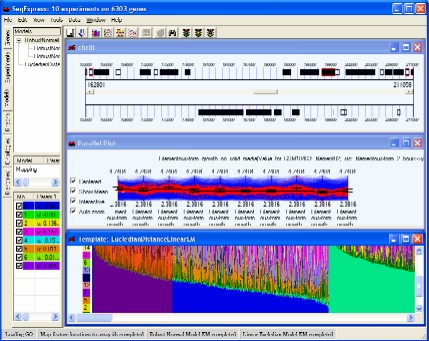
SeqExpress provides a number of visualisations, algorithms and annotation tools for the analysis of gene expression experiments. The tabs on the left hand side of SeqExpress provide information about the experiments and any analyses that have been performed. Visualisations of expression experiments, cluster comparisons, genomes, ontology graphs, hierarchies and probabilistic models are viewed on the right hand side pane. Information about loading data into SeqExpress can be found in the tutorial on importing and exporting data or if you are using the server version you can use the tutorial on how to load GEO information into the SeqExpress server.
Showing a SeqExpress session, where a series of models have been used to analyse the data. The expression profiles and genome locations of genes that best fit one of models have been selected.
The tabbed pane on the left of SeqExpress provides access to the following elements of functionality:
|
A wide range of analysis data manipulation and visualisations tools are also available through the main SeqExpress menu.
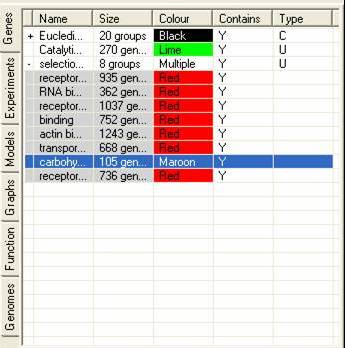
The Gene Tab contains information about all the sets of genes that have been either created by SeqExpress or defined by the user. It is possible that a subset of genes be grouped together, this is either the results of a cluster analysis or when the user has read in category information from a file. Such groups can be expanded by selecting the (+) arrow in the first column of the gene list.
The table contains information about: the name of the gene subset; the number of genes in the subset; the colour which should be used to identify the subset; if their is an overlap between the currently subsets and any of the others; and how the subset was created (e.g. U=created by users,C=created by partition based clustering, H=created by hierarchical clustering, R=created by refining another subset).
Selections of genes can be created in one of 4 ways:
To examine the genes within a subset in more detail, simply select the required subset and the information will be displayed within the Genes table. By selecting more than one list and right clicking and selecting the show selected option it is possible to view more than one subset .It is possible to remove unwanted items and rename items using the gene list popup menu.
Each selection within SeqExpress can be shown as a different colour. This is useful when examining the results of a cluster/em based analysis, as it is possible to look at all the different groups of genes within the experiments. To be able to colour a selection simply select the third column (by clicking on the colour cell). This will bring up a colour dialog, which can be used to select the colour which should be used when displaying items in this selection.
By selecting the popup menu groups of genes can be removed, merged, renamed.
The experiment lists contains details about the experiments that are currently being viewed, additionally it can contain information about projections that have been derived from the lists). The tab shows details about the experiments:
By selecting the popup menu individual experiments can be renamed. A number of tools are available for transforming, constraining and filtering the data.
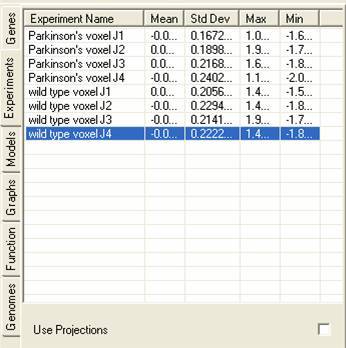
By selecting the Use Projections check box information about projections that have been derived from the experiments will be shown. The genes can then be viewed using the projection vectors through any of the views or can be analysed using any of the clustering tools.
The models tab contains information about any models that have been created or imported, and information about any data that has been 'fitted' to these models. More information about using models within SeqExpress is available. As well as information about how models are generated and how they can be visualised.
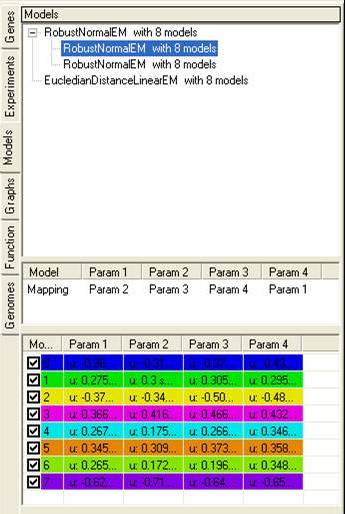
The top pane shows a tree of models, with each parent node showing the model itself, and each child node showing data sets that have been fitted to the model. By selecting the popup menu on the top pane it is possible to rename, remove or visualise each of the models (or fitted data sets). It is also possible to generate clusters based on the models or the data that has been fitted to them.
The middle pane shows how the different data sets have been fitted to each of the models, each model consists of n-parameters which are fitted to one or more experiments.
The bottom pane shows details about each of the models, depending on the model that has been used these parameters may change depending on the distributions of data points within each experiment.
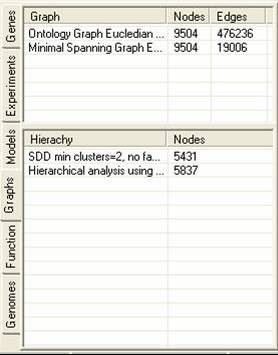
The graph tab contains information about graphs and hierarchies that have been constructed using the experiment data. A number of different graphing and hierarchical analysis methods are available, and the results of these are placed in the tables in the graph tab. By selecting the popup menu in either table it is possible to remove or rename items. It is also possible to generate clusters from either the hierarchies or graphs (the methods for doing this vary considerably). Hierarchies can be visualised as dendograms.
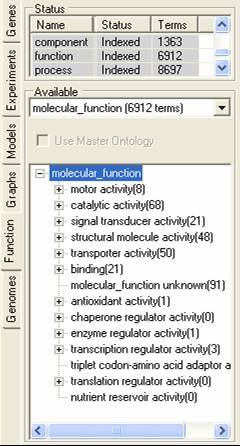
The function tab allows for the importation and browsing definitions of protein function. this function can be involvement in a pathway, protein interaction information or gene function definitions. The function description information can be read into SeqExpress from an OBO formatted file, these descriptions are then associated with individual experiments elements my mapping them to annotations (which can be retrieved from either the seqExpress server or from the experiment data file). A tutorial is available showing how to import fucntion information.
Different functional descriptions can be selected using the middle option menu, and can optionally be associated with a master (or mapping) ontology. The functional descriptions can be browsed using the bottom navigable tree. By selecting the popup menu in the lower tree the functional element and its relationships can be viewed, and all associated genes can be saved to the gene tab.
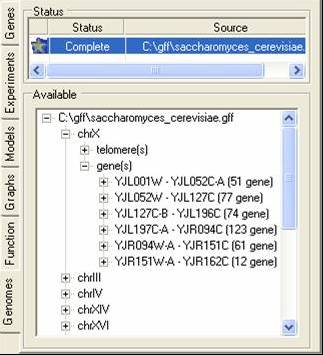
The genome tab contains information about the chromosome location (or putative locations) of elements in the gene expression experiments. These locations are read in from GFF or PLS formatted files, and correspond to the genes themselves or to elements associated with genes (e.g. promoter sites). A tutorial is available showing for to import such data.
The bottom tree can be used to browse through the locations. By using the popup menu the locations can be renamed, removed or visualised.
An overview of the menu based functionality is given below.
File: functionality relating to reading/writing of data
- Reopen/Open: This will restore information from a previously stored session. Visualisation information is not restored.
- Import: Data can be read into SeqExpress from either the SeqExpress server or from local files. The advantage of having information available on the server is that it can be shared within a group, a full set of annotations are available, the data is verified, and data access is quicker with loading involving one button click (File->Import->"groupname"). The import tool is available for loading data onto the Server. Tab seperated files can be imported into SeqExpress, an example file is available as well as a tutorial.
- Save/Save As: This will save information about the current session to file. Visualisation information is not stored.
- Export: Data is exported to either bioconductor files, tab separated files.
- Monitor: this tool allows for browsing of logs and control of the currently analyses that are being performed.
- Check for Updates: this will scan the SeqExpress web server to see if a new version of SeqExpress is available.
- Close/Exit: Either close the current session or close the whole application.
Edit: functionality related to the editing/creating of analysis information
- Copy Selection/Copy All: will either copy the current selected items (in a visualisation) or all the genes as a new item in the Gene Tab.
- Merge Selection: Will copy all the currently selected groups of genes in the Gene Tab into one new group of genes (gene can be merged using union, intersection or difference operations)
- Search by keyword/filter/similarity/profile will allow for searching for genes which either have the same keyword, can be filtered numerically or allows for them to be selected interactively.
- Annotation: Select the required annotation (e.g. Unigene, LocusLink, GO) that should be usedby default for any mapping operations
- Load Selection/Models/Graphs/Functions/Locations: Allows for loading of categories of genes or models that have been defined using a different data set, or graphs of genes, or associated functions(as ontologies in OBO format), or genome information (in GFF version 1or 3, or PLS format).
View: functionality related to the visualization of either the gene expression profiles or the results of analyses.
- Gene Table : shows a list of the currently selected genes, theri experimental values, the default annotation and any descriptions.
- Gene List Editor : allows for the editing of of an individual group of genes.
- Distributions: Shows the distribution of expression data across all experiments as a series of histograms
- Scatter Plots: Shows a series of scatter plots of the chosen experiments
- Parallel Plots: Shows a parallel projection of the chosen experiments
- Cluster Analyser: Allows for the examination of the results of an individual cluster analysis (intra-cluster)
- Cluster Comparer: Allows for the comparison of the results of a number of different cluster analyses (inter-cluster)
- Experiment Hierarchy: Shows a dendogram of the similarity of the different experiments.
- Genome Features: shows the location of individual genes and associated features on a chromosome
- Function TreeMap: TreeMap visualisations for examination of scores associated with concepts (e.g. number of assigned instances)
- Function Graph: Ontology Graph visualisations for the analysis of interrelationships within the ontology;
- Function List: Table Visualisations for the viewing and editing of the specific concept details
- View Model: Probability Model visualisations are provided for exploring the results of a mixture model analysis by showing the probabilities of each gene belonging to each model
- View Hierarchy: Shows a dendogram which plots the results of a hierarchical cluster analysis
Tools for the analysis of the experiments
- Find Clusters: finds partitioned clusters using a variety of distance measures, heuristic or graph navigation techniques.
- Refine Clusters: either refines clusters based on predefined categories (e.g. gene ontology) or by looking for a mixture of models.
- Validate Clusters: will generate a score for clusters which describes how 'good' a cluster is. The validation can use any of the standard SeqExpress distance measures. The validated cluster information can be viewed in the cluster analysis visualiser.
- Models: provides tools for generating models, performing analysis using models and generating clusters based on models.
- Graphs: provides tools for generating graphs and partitioning them to find clusters.
- Hierarchies: provides tools for building hierarchies of genes, and using them to generate clusters.
- Find Concepts: finds concepts that explain co-occurance or co-variance relationships within the data.
Data: functionality relating to the direct manipulation of the gene expression values.
- Filter By Value: filters the data by a series of numeric rules
- Filter By Selection: filters out/in genes that have been selected by the user
- Constrain: constrains the data to be between a series of maximum and minimum values
- Transform: applies a number of different transformations to the data (e.g. rank)