Visualisations are provided for the analysis of the results of both hierarchical clustering and probabilistic mixture modeling. The visualisations are:
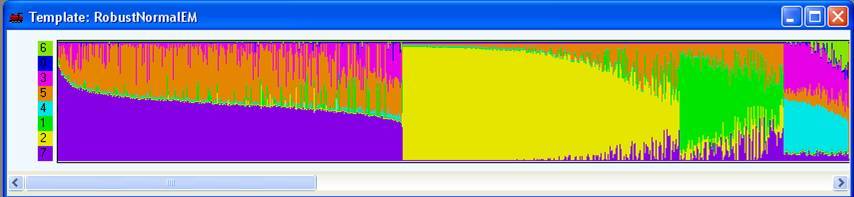
Probability Model visualisations are provided for exploring the results of a mixture model analysis by showing the probabilities of each gene belonging to each model
Dendrogram are provided for viewing the hierarchical relationships within the data which have been established using one of the hierarchical cluster techniques.
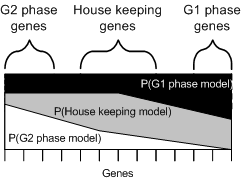
The results of a probability model analysis is a series of models and associated probability scores. These can be visualised directly by showing the showing all the genes and their probabilities on one display. Grouping genes with similar probabilities together makes it possible to visualise the natural clustering that will occur.
The actual visualisation is shown below. The visualisation only works if a good layout policy (for placing similar items next to each other) is provided - in this implementation two main layout policies are available:
The popup menu allows for the changing of the layout mechanism and the movement of specific models up/down.
The visualiser allows you to identify how well the models describe the data, and gain an understanding into the distinction between models.
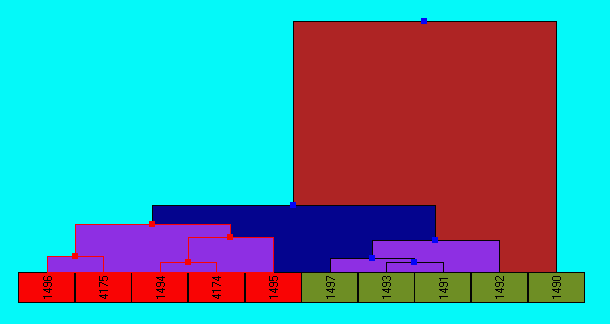
Hierarchical clustering information is available for both the comparisons of experiments and for exploring relationships between gene expression profiles. The experiment hierarchy is computed when the option is selected (as it is a generally quick to compute), whilst to visualise a hierarchy of gene expression profiles these must first be created by using the Find->Hierarchies option. The visualisation shows the results of the hierarchical analysis, hierarchy groups can be selected (using shift/ctrl combinations), and this selection will be echoed in all currently open visualisations. Individual genes can also be selected from the list on the bottom of the dendrogram.
A number of non-overlapping/partitioned clusters are automatically generated when the hierarchy is first created, to create a different number of clusters (which would involve a different level of tree navigation) select the Cluster button in the top right of the viewer, after specifying the number of clusters to create these will be added to the gene tab.