When data sets are read into SeqExpress, the data is processed using a cascade of:
This is the first part in the filter, constrain and transform cascade that a data set undergoes within SeqExpress, for more information see Data menu.
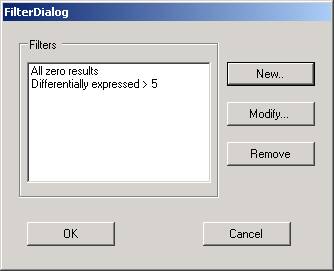
Filtering out of genes will decrease the number of genes to be examined. Any number of filters can be applied to a data set. The addition, modification or removal of a filter will affect the whole data set such that any subsets of genes and visualizations will be invalidated (as genes that were represented in these samples may have been filtered out).
To apply a new filter, select the filter option from the data menu - this provides a means to add new filters, to modify existing ones, and to remove filters from the list.
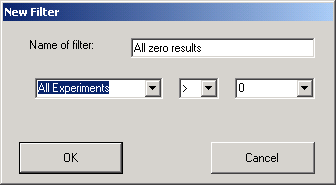
The filter is defined using matching rules, in the case shown above the filter defined is such that only genes that have intensities in all the experiments greater than zero will be used.
Unwanted genes can also be filtered out by selecting one of the two filter by selection options. These options provide a means to either remove all the genes that have been selected (or are within a cluster) or to remove all genes that are not within a specific selection or cluster. To reset the information a reset filter mean option is provided.
This is the second part in the filter, constrain and transform cascade that a data set undergoes within SeqExpress, for more information see Data menu. Constraints provide a mechanism to ensure that all the results from the collection of experiments reside within a certain range.
It is possible to add, modify or remove a constraint by selecting the constraint option in the data menu. For either all the experiments or for individual ones it is possible to enter either floor or ceiling values.
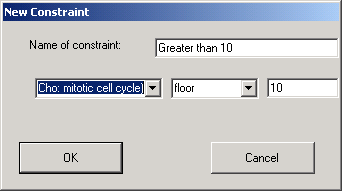
The above shows the dialog that is used to define a constraint that sets a floor value on the specified experiment, so that all values that are less than ten are automatically set to 10.
The data can be transformed in a number of ways by using the transform option in the data menu. It is possible to transform the data by:
![]()
The transformations can be specified using the dialog from the data/transform menu. The transformation are applied in the following order: normalization,proportional adjustment,log.
Proportional adjustment and ranking of the data are the more commonly used techniques, as they allow for the comparison of data values that are independent of different experimental conditions.
Ranking is a useful technique, although it will adjust the values so that the differences between the more extreme values are minimised (effectively exaggerates the mediocre). Local ranking is useful for comparing different gene chip experiments, whilst global ranking is more applicable to SAGE experiments.
Proportional adjustment will alter the data so that unusual profiles are exaggerated (gene that are only highly expressed in a few experiments). If only one dimension is used then the effects of per gene/per experiment will result in major differences (if a per experiment proportional adjustment is used then this is adjusting the values so that the sum of all the expression profiles in each experiment is the same).